
For large-scale projects like bird atlases, it’s important to find the sweet spot for survey effort
LINKED PAPER
Raising the bar for the next generation of biological atlases: using existing data to inform the design and implementation of atlas monitoring. McCabe, J. D., Anich, N. M., Brady, R. S. & Zuckerberg, B. 2018. IBIS. DOI: 10.1111/ibi.12561. VIEW
Since the 1950s, biological atlases have been implemented worldwide to document the occurrence of plant and animal species. An atlas is generally a citizen-science project that involves dividing a state or country up into standard-sized blocks and deploying surveyors to determine occurrence and/or (in the case of most bird atlases) the breeding status of species within those blocks.
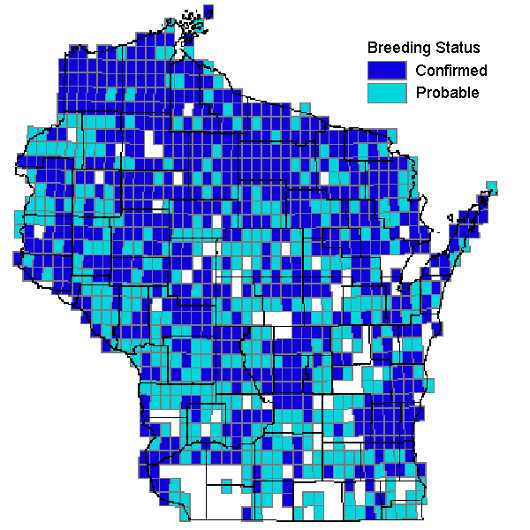 Figure 1 Red-eyed Vireo (Vireo olivaceus) map from the first Wisconsin Breeding Bird Atlas, showing their occurrence nearly statewide (Cutright et al. 2006)
In the era of big data, second generation atlases go beyond maps of occurrence and breeding behaviour, to explore patterns of abundance. The map above suggests that Red-eyed Vireos occur across almost all of Wisconsin, but if you use standardized counts and model their abundance across the state, you see that in fact they are NOT equally abundant across the state, instead being more abundant in the northern half of the state, especially the northeast.
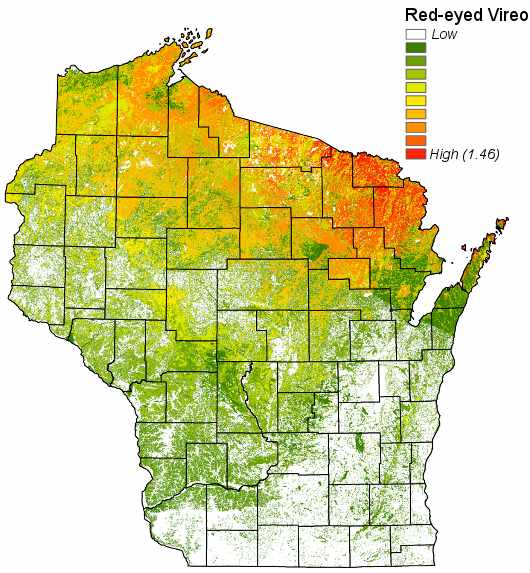 Figure 2 Draft relative abundance map of Red-eyed Vireo created using point count surveys for the second Wisconsin Breeding Bird Atlas, showing the species much more abundant in the northern third of the state
However, if you were to design a survey method to survey a large area (Wisconsin is 170 km2), how would you go about it? How many points would you need to obtain informative models for birds with various population sizes and distributions? What factors affect these decisions and how would you go about making them? Use few too points, and you will not be able to model species with low or medium abundance. Use too many points, you will overspend your limited budget for little additional return, and make the survey more difficult to replicate in the future. In this paper, we were interested in finding the sweet spot of effort needed, where we would be able to model most species that were of high to medium abundance for a reasonable investment of resources.
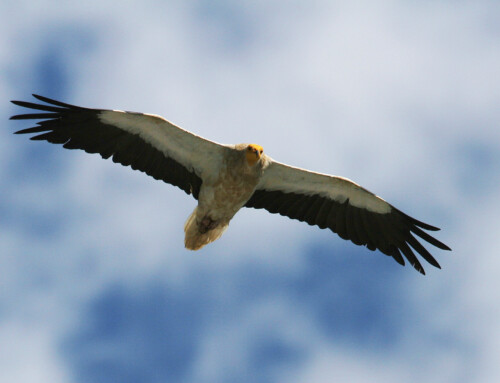
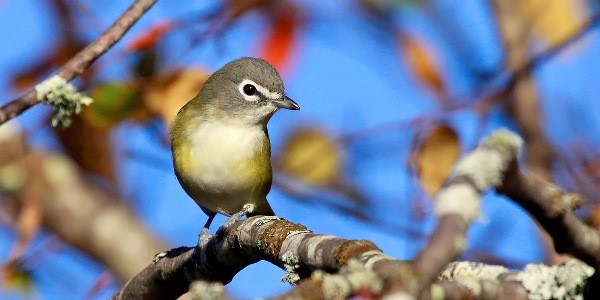
We began by examining data generously provided by Andrew Wilson, as part of similar stationary point counts conducted for the second Pennsylvania Breeding Bird Atlas (Wilson et al. 2012). We then identified three bird species that occurred in both Wisconsin and Pennsylvania and varied in their abundance and detectability, Chipping Sparrow (Spizella passerina), which had high abundance and high detectability, Blue-headed Vireo (Vireo solitarius), which is of medium abundance and medium-high detectability, and Canada Warbler (Cardellina canadensis) which was towards the low end of what we could hope to model, for both abundance and detectability.
Using the Pennsylvania data, we estimated statewide abundance and detection parameters for each individual species using multinomial N-mixture time-removal models (Kéry & Royle 2016). Using this method, a population is sampled successively and individuals are removed during each time interval so that, on average, a depletion of encounter frequencies is observed in each successive removal.
Using these estimates as starting points, we simulated datasets to test various sampling strategies and identified sample sizes that provided unbiased, precise, and accurate estimates of abundance. With these sample size estimates, we then determined the spatial stratification of choosing primary sampling units (atlas blocks) and allocating secondary sampling units (survey points).
 Figure 3 Simulations exploring how bias and precision of the estimates of mean statewide abundance for three species are affected by the number of secondary sampling units (i.e. point counts) and detection probability. The panels (A–C) show results for the entire range of detection probabilities, the vertical dashed lines and grey bars represent the estimated detection probability and the 80% confidence intervals of the original null model, and the horizontal dashed line depicts the estimates of true abundance/populations size. The trend for each sampling intensity is based on 1000 simulated datasets. While estimates for the Chipping Sparrow and Blue-headed Vireo approach the correct population size at even the lowest number of point counts, Canada Warbler (the species with the lowest abundance and detectability) performs poorly with smaller sample sizes of points, and estimates do not settle down until they reach a detection probability greater than observed in nature
Major findings:
A species’ abundance and detectability were the most influential factors in generating a point count network that produced reliably accurate estimates of statewide mean abundance.
Most sampling schemes produced accurate mean statewide abundance estimates for species with medium to high abundance and detection probability, but estimates varied significantly for species with low abundance and low detection probability (Figure 3).
If certain species bordering on low abundance and/or low detectability were high priority, these would be the species to focus most attention on when selecting a sample size. However, as either abundance or detectability decrease, modelling these species reliably becomes difficult at any sample size, so certain species may be difficult to model with a general survey and may require a targeted survey design.
By estimating this sweet spot for effort, the Wisconsin Breeding Bird Atlas will spend half as much on point counts compared to a full block design that may have been otherwise thought necessary.
What did our Wisconsin point count design end up looking like?
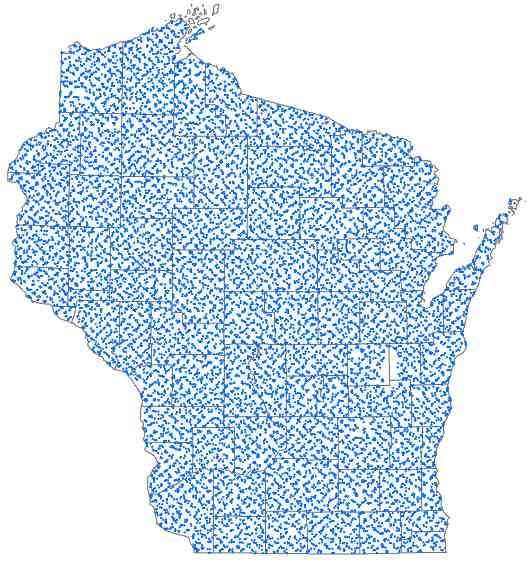 Figure 4 The point count design selected for the Wisconsin Breeding Bird Atlas resulted in 5 points in half of all atlas blocks (approx. 4.8 x 4.8 km), in a checkerboard pattern (about 16,000 points total). This should allow us to model most songbirds of high to medium detectability and abundance
References
Cutright, N.J., Harriman, B.R. & Howe, R.W. 2006. Atlas of the Breeding Birds of Wisconsin. Waukesha: Wisconsin Society for Ornithology.
Kéry, M. & Royle, J.A. 2016. Applied Hierarchical Modeling in Ecology: Analysis of Distribution, Abundance and Species Richness in R and BUGS, Vol. 1. London: Academic Press.
Wilson, A.M., Brauning, D.W. & Mulvihill, R.S. 2012. Second Atlas of Breeding Birds in Pennsylvania. University Park: Pennsylvania State University Press.
Image credit
Featured image: Blue-headed Vireo, Vireo solitarius © Ryan Brady
Blog posts express the views of the individual author(s) and not those of the BOU.
If you want to write about your research in #theBOUblog, then please see here.